
 English
 Čeština
 Deutsch
 Español
 Polski
 Português
 Türkçe
 Русский
 Українська
 हिन्दी
 中文
What this function does
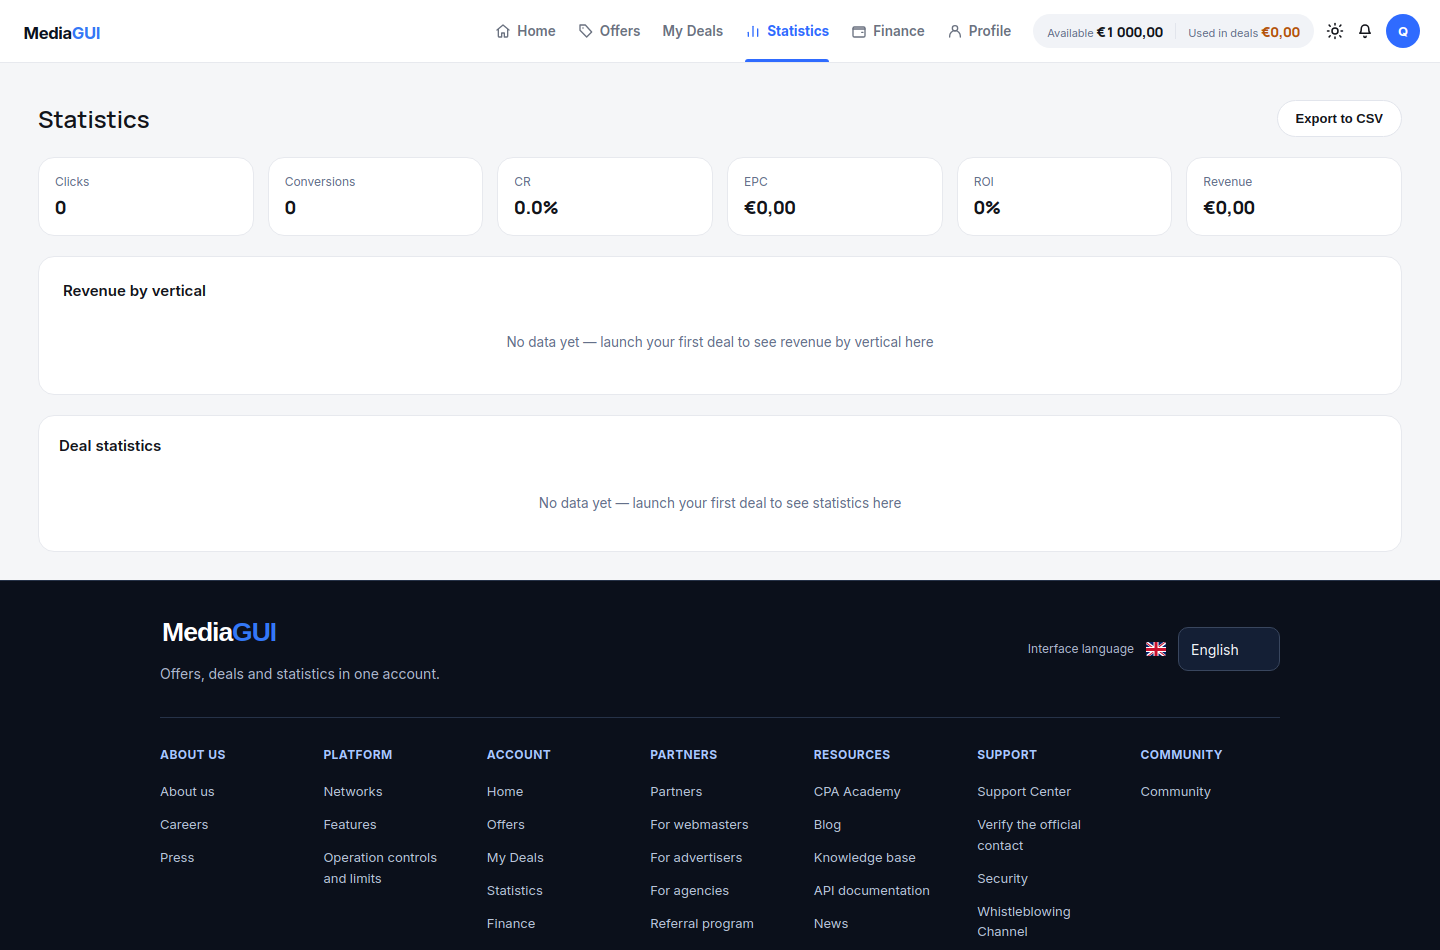
Open Statistics, select a period and compare equal intervals. Clicks describe volume, conversions recorded actions, EPC revenue per click, and CR conversions relative to clicks. Small samples are volatile. Inspect deal details for a specific result; a chart does not verify external sales.
Before you begin
Access to /statistics. Empty data is a valid state for an account without activity.
Step by step
- Open /statistics and note the currently selected period. Read the metric label and currency before interpreting any number.
- Choose another available period and observe the chart and summary together. Allow the request to finish before comparing values.
- Open the relevant deal records to understand what the statistic summarises. A chart point alone is not a payment confirmation.
- If the account has no activity, use the empty state as the result. Distinguish an empty dataset from an explicit loading or request error.
Example
A total for seven days and a total for one day answer different questions. Select the same period on both views before comparing their values.
The interface in practice
Actual local MediaGUI interface with a test session and demonstration data. This is not a customer account or proof of a production transaction.
Expected result
You can state the period, metric and scope of a figure, and can explain why totals from different periods are not directly comparable.
Common problems and solutions
- The chart is empty: check the period and whether there is activity. Reload only after checking for a visible request error.
- Figures appear inconsistent: compare the same dates, metric and currency, then record the relevant deal identifiers. A graph is not evidence of a guaranteed return.
Never share passwords, verification codes, wallet details or personal documents in screenshots. Crop unrelated information before contacting support.